Researchers at the University of Washington are investigating how genetic changes impact the severity of schizophrenia symptoms. A new study supports the idea that deletions in genes that regulate early brain and neuron development are associated with more severe features of schizophrenia spectrum disorders, particularly lower cognitive abilities.
Researchers at the University of Washington are investigating how genetic changes impact the severity of schizophrenia symptoms. How schizophrenia manifests — and how severely — differs between patients. Photo: Pixabay
Schizophrenia affects approximately 23 million people worldwide, with onset usually occurring during a person’s late adolescence to their 20s. Impairments associated with schizophrenia include hallucinations, delusions and disorganized thinking and behavior.
Now, researchers at the University of Washington are investigating how genetic changes impact the severity of schizophrenia symptoms. A new study, published in the American Journal of Psychiatry, supports the idea that deletions in genes that regulate early brain and neuron development are associated with more severe features of schizophrenia spectrum disorders, particularly lower cognitive abilities.
How schizophrenia manifests — and how severely — differs between patients. Poorer cognitive functioning in schizophrenia is associated with more treatment-resistant forms of the disease. Jennifer Forsyth, co-author and assistant professor of psychology at the UW, said understanding early developmental genetic factors could help identify people who could benefit from earlier, targeted inventions.
“For a subset of individuals, we may need to be thinking about how we can create treatments earlier in brain development that will help compensate for the fact that certain genes are being deleted,” Forsyth said. “Is there some kind of medication that can help with that? Down the road, could there be gene therapies for some of these individuals? I do think this research is going to be important for changing treatment direction.”
The researchers studied the DNA of more than 600 people with schizophrenia spectrum disorders. The team compared these results to data from patients’ relatives, people without schizophrenia and nearly 10,000 children participating in the Adolescent Brain Cognitive Development Study.
People with schizophrenia who carried the deletions tended to perform worse on cognitive tests — showing poorer memory, thinking and attention skills than people with schizophrenia who didn’t carry the deletions. Similar, weaker associations were also seen in the general population, which suggests these variants may influence brain development more broadly, even in individuals without schizophrenia.
The study also showed these specific genetic deletions were associated with differences in brain structure, including higher gray matter volume and cortical thickness. This is the opposite pattern researchers typically see on average in schizophrenia, Forsyth said, which again suggests variability between patients.
“This study helps us understand the specific way somebody manifests a disorder,” Forsyth said. “It’s sort of a cumulative effect of different risk profiles. We all carry tons of genetic variants, and the specific types of variants we have and how they combine is very complicated. These things aren’t totally deterministic, but I do think understanding which specific aspects of brain development are affected by the genetic variants a person carries, and how this shapes how the disorder manifests, can start to inform how we think about different treatment approaches.”
Other UW co-authors from the Department of Psychology were graduate students Jinhan Zhu, Zachary Trevorrow and Mahnoor Hyat, undergraduate research assistant Ariana Chavannes, research coordinator Sam Sievertsen and research technologist Sophie Ferreira-Ianone. Matthew Conomos, a UW senior research scientist in biostatistics, was also a co-author.
This study was funded by the National Institute of Mental Health, the Brain and Behavior Research Foundation, the National Center for Advancing Translational Sciences UCLA Clinical and Translational Science Institute, the UCLA Brain Research Institute and the Shear Family Foundation.
Housed in the UW School of Pharmacy, the Institute for Innovations in Drug Delivery and Disposition (I2D3) brings together experts in artificial intelligence, drug discovery, pharmacology, data science and biotechnology to ease the bottleneck between promising molecules and successful drugs.
The Institute for Innovations in Drug Delivery and Disposition (I2D3) is led by three UW faculty members: Gaurav Bhardwaj (left), associate professor of medicinal chemistry; Marco Pravetoni (center), professor of psychiatry and behavioral science in the UW School of Medicine; and Nina Isoherranen (right), the Milo Gibaldi Chair of Pharmaceutics.
Drug development is among the slowest, most failure-prone processes in modern science, with about 90% of drug candidates never reaching the market. Today, artificial intelligence methods have accelerated the first step — plucking promising molecules out of endless possibilities — but countless challenges remain. A successful drug must be not only safe and effective, but also able to bypass the body’s defenses and reach the right target.
Most drug candidates fail such optimizations. That’s where a new research institute at the University of Washington has focused its attention. Housed in the UW School of Pharmacy, the Institute for Innovations in Drug Delivery and Disposition (I2D3) brings together experts in artificial intelligence, drug discovery, pharmacology, data science and biotechnology to ease the bottleneck between promising molecules and successful drugs.
The Institute opened in July 2026 and is led by three UW faculty members: Gaurav Bhardwaj, an associate professor of medicinal chemistry who oversees the Institute’s AI-enabled molecular design; Nina Isoherranen, the Milo Gibaldi Chair of Pharmaceutics and expert in drug metabolism and disposition; and Marco Pravetoni, a professor of psychiatry and behavioral science in the UW School of Medicine, who leads drug discovery, translation and commercialization efforts.
UW News spoke with the three co-directors about why drug candidates fail, how AI is speeding drug development and how I2D3 hopes to help get drugs to market more quickly.
What separates a promising molecule from a full-fledged drug? What properties need to be considered, and how can a developer work toward them?
Gaurav Bhardwaj: It really depends on the disease indication you are targeting and the therapeutic modality. Let’s say you have a promising molecule that interacts with the disease-causing protein. Delivery becomes equally important — do we need an orally delivered drug? Do we need to cross the blood-brain barrier? If the disease requires daily dosing, then injectable or IV methods aren’t optimal. If it’s delivered orally, then the molecule needs to be able to get across the gut barrier, and also needs to be stable enough that it doesn’t get chewed up by the body. It also needs to stay in the body for a reasonable time. A successful drug molecule has to meet all these and more criteria, and ultimately all these criteria are encoded by the sequence and structure of the molecule.
The Institute is devoted to aspects of drug development that are often overlooked. What problem do you see the Institute being able to help solve?
GB: Traditional drug discovery and development is a trial-and-error-based process. Either you find a useful molecule in nature and spend years optimizing it for human use, or you create many random combinations of molecules and hope that one of them has the function you need. Both of these approaches are highly unsuccessful, which has created a bottleneck.
Now the field is also focusing on an idea called rational drug design. It started long before AI but is now becoming even more common. People are using AI methods to design new molecules. However, a lot of that work has focused on the first step — finding a molecule that binds to a specific protein, or has a specific function in the body. That’s still not a drug, it’s just more candidates.
The bottleneck has now shifted. It’s no longer finding that first molecule, but now, how do you add all the other drug-like properties? That’s what the Institute is trying to do. Let’s build the models that ultimately make molecules that are going to be successful all the way through the drug development pipeline.
Marco Pravetoni: I see our work also as accelerating discovery. I work on substance use disorders, and my lab develops vaccines, antibodies and next-generation antibody-like molecules that target drugs in the body. With these new tools, instead of working to design 10 antibody candidates in a lab, we could design 1,000 or more, and then we can accumulate enough data to reduce any risks, so that what we bring to clinical trials is more likely to be successful. AI can do a lot of that.
How can you make it more likely that a drug candidate succeeds in trials?
Nina Isoherranen: Part of it is predicting what’s going to happen to a drug in humans before it’s ever given to humans. That should increase the success rate and eliminate the waste of doing a lot of unsuccessful trials.
We can also build machine learning and AI approaches to predict drug disposition in an individual person. What we talk about today are ‘digital twins,’ which refers to a computational model of the individual patient and their characteristics. For example, how does your kidney function? What is your body mass index? And so forth. Then we generate a digital version of you. We can then predict how a certain drug would behave in your body and build the best strategy.
There’s also an access-to-treatment question here. Pregnancy is a great example — we often don’t know how drugs work in pregnant women because we’ve never done trials. To be safe, we say that pregnant people shouldn’t take those drugs, but that means they don’t have access to a potentially hugely beneficial medication. If we can use AI and machine learning to predict how pregnant people respond to medications and how their bodies handle drugs differently from nonpregnant people we can make more medications accessible
Now with AI and machine learning, I think we can get to a place where we can truly sample the full space of possibilities.
How can the methods you’re building help with these individualized treatments?
NI: We know that drugs behave differently in different people. Even if we give them the exact same drugs and concentrations, people may still have different responses because of factors inherent to our bodies.
During drug development the candidate drug needs to be studied to see responses in different populations. Before you get a drug approved, you need to understand how liver disease, for example, is going to change exposure to that drug and whether you need to change the dosing. There’s a lot of guidance on drug interactions. Pharmacists manage drug interactions all the time, but it gets very complicated when you combine multiple patient factors. Now, if we have good predictive tools, we can predict what’s going to happen without having to do trials.
The ultimate goal here is to be able to predict, using model computational tools, what’s going to happen in individual humans before you ever give them a drug. What’s the right dose? The right timing?
UW has established itself as a leader in these fields already. I’m thinking especially of the UW Medicine Institute for Protein Design, whose director, David Baker, recently won the Nobel Prize in Chemistry. How does I2D3 fit into the broader UW ecosystem?
MP: IPD is a world leader in designing novel proteins, and the UW also has outstanding capabilities in clinical testing and implementation through the Institute of Translational Health Sciences. However, there remains a critical translational space between discovery and clinical application — one that focuses on the pharmaceutical development needed to turn promising innovations into viable therapeutic products. That’s where I2D3 can play a leading role.
For example, when researchers at IPD develop a new protein, I2D3 can partner with them early to address formulation, manufacturability, stability, delivery, and other key pharmaceutical considerations that are essential for advancing a discovery toward the clinic and ultimately the marketplace. I2D3 would serve as a core translational partner, helping bridge the gap between innovation and implementation.
IPD brings unmatched strengths in protein design, ITHS provides expertise in clinical translation, and I2D3 contributes the drug development and pharmaceutical sciences capabilities needed to move discoveries across the translational continuum. Together, these organizations can create a powerful and highly integrated ecosystem.
Nobody can agree on how, exactly, to define ultra-processed foods. The lack of a clear definition has stymied legislative and regulatory efforts to curb UPF consumption, and caused confusion for people evaluating their own diets.
Research has associated ultra-processed foods, like the brightly colored snacks pictured above, with a range of health risks, including heart disease and depression. Credit: AngelaMacario via iStock
But there’s a glaring problem: Nobody can agree on how, exactly, to define ultra-processed foods. The lack of a clear definition has stymied legislative and regulatory efforts to curb UPF consumption, and caused confusion for people evaluating their own diets.
This spring, a panel of 14 nutrition, food science, policy and legal experts gathered to create a more practical and operational definition. The panel’s final report, published in May, suggests an ingredient-based approach to identify ultra-processed foods, while also recommending a series of policies to reduce people’s exposure to them.
The panel was co-chaired by Jim Krieger, clinical professor emeritus of health systems and population health at the UW and executive director of the nonprofit group Healthy Food America. UW News sat down with Krieger to discuss the new definition, the debate around ultra-processed foods and how people can limit their consumption.
How have we traditionally defined ultra-processed foods, and where does that definition fall short?
Jim Krieger: The ultra-processed food concept was developed by Carlos Monteiro, who’s a physician and epidemiologist at the University of Sao Paolo in Brazil. He was trying to understand an increase in obesity and chronic disease rates, particularly in kids and young adults, and noticed some important changes in the diet that weren’t fully explained by just the usual nutrient profiling — like fat, sugar, salt. Monteiro came up with this concept of ultra-processed foods. The categorization system is called Nova, which means ‘new’ in Portuguese, and classifies foods across a spectrum beginning with unprocessed ingredients and ending in ultra-processed. Ultra-processed foods are the ones that are the most highly processed industrial products, basically.
The Nova definition is geared toward research, to really examine the effects of ultra-processed foods on a range of health outcomes. Using it, numerous studies have found ultra-processed foods to be associated with a whole host of health problems, like diabetes and heart disease and depression. That’s the basis to say, well, there’s probably sufficient evidence to figure out what we can do to reduce exposure to ultra-processed foods by reducing sales and consumption. That requires policy, and to have policy you need to have a definition of ultra-processed food that’s suitable for regulation or legislation, and that’s where the rub comes. The definition for research doesn’t really work in a policy context, because the Nova research definition uses multiple factors, including ingredients, processing techniques, and other factors to identify products as ultraprocessed. Applying Nova can require individual-level review of ambiguous products by skilled nutrition experts that may not be feasible in policy contexts.
You co-chaired a panel of 14 experts who came up with a new definition. What did that work look like, and what’s your new definition?
JK: We tried to come up with a simple definition that could be used in practice. We said the starting point, scientifically, is Nova, because that’s where there’s evidence linking UPFs to harms. But we wanted to come up with a way to identify products that would meet Nova classification using only ingredients on nutrition labels, which is a much more feasible approach compared to the method used in research studies.
We went through a fairly technical process. We got a database of all packaged foods in the U.S., looked at all the ingredients in there and cross-referenced them with technical functions that are listed in Nova’s definition — emulsifiers, coloring agents, sweeteners, things like that. We also considered a bunch of non-culinary ingredients, which are the ones you wouldn’t use in your kitchen, like hydrolyzed protein and modified starches. This let us develop a list of “marker” ingredients found in UPFs.
Under our definition, if a product has just one of these marker ingredients, then it is ultra-processed food. Now in reality, very few ultra-processed foods ended up having only one marker. Most had three, four, five or more. We also found that this approach successfully identified 98% of all UPFs.
Panel definition of ultra-processed foods
A product is ultra-processed if it contains a cosmetic ingredient (substances that increase the product’s sensory appeal such as flavors, colors, or emulsifiers) and/or a non-culinary industrial ingredient (substances not usually found in home kitchens, like high fructose corn syrup). If a product meets the FDA criteria for a “healthy” claim, then it should be exempt from UPF policies unless it contains a non-sugar sweetener.
One criticism of the movement against UPFs has been that some foods that are technically ultra-processed are actually quite nutritious. I’m thinking of products like yogurts, whole-grain breads and tofu. How does your definition account for that?
JK: You want your definition to be sensitive enough to pick up most UPFs, but also specific — that is, not capture foods that are not truly UPFs or even those that can be part of a healthy diet. The way we addressed that was the FDA, a couple years ago, developed criteria for what they call a ‘Healthy’ claim. If a company wants to say its products are healthy and put that on the package, it has to meet FDA-approved criteria.
We decided that even if a product is ultra-processed, if it meets the FDA’s criteria for a ‘Healthy’ food, then it should be exempted from policy. That cuts out edge cases — healthier foods that are also UPFs.
Your final report also dives into policy and makes recommendations for lawmakers to consider. What is the current status of ultra-processed food policy across the U.S.?
JK: Over the last couple of years there has been a flurry of activity, particularly at the state legislative level. Some states say they’re getting rid of ultra-processed foods in school meals, for example, but they have a somewhat random list of ingredients or additives they don’t like.
A few states have tried to take a more evidence-based approach. The best example of that is California, where they passed legislation to phase out ultra-processed foods in school meals. They used the same kind of ingredient-list approach that we recommend, simplified a little bit. However, for a food to be a UPF under California’s definition, it must also be high in fat, sugar or salt, which raises a problem — about 35% of all ultra-processed foods do not have those levels. Proposed legislation in states like Pennsylvania have avoided this problem by sticking with the Nova-based definition, as recommended by our expert panel, rather than adding on fat, sugar and salt criteria.
There’s also been a huge amount of movement in a couple of countries, especially in Latin America. Furthest along is Colombia, where the government just issued a regulation to require ultra-processed food labels on packages. They’re basically using the Nova definition as well.
There are policies moving now, which is why we felt it was important to say, use a good definition of ultra-processed for what you’re doing, and then think about certain policy ideas as the best bets for doing something about the problem. For us, those ideas include requiring labels on packages identifying a product as ultra-processed and removing UPFs from food served in schools, childcare and in government facilities.
Many of the factors that lead people to choose ultra-processed foods are systemic. As an example, food deserts leave some people without easy access to affordable fresh foods. How did the panel consider those factors in making your policy recommendations?
JK: Increasing access to healthy foods gets into another set of policies that are well-described and, to varying extents, are being put into place. Our panel focused specifically on UPF policies. We did assess whether any of our policy recommendations would have unintended consequences of making food less available or affordable for people with low incomes and then we figured out strategies for mitigating those effects.
A great example would be if you tax even a subset of ultra-processed foods, that’s going to make them less affordable, and that’s a challenge. We recommend that the tax revenues raised from these policies go toward vouchers or incentives for people with lower incomes that they can cash in for fruits and vegetables at a more affordable price.
We also rejected some policy ideas. One was restricting the use of SNAP (the Supplemental Nutrition Assistance Program, commonly known as food stamps) benefits for purchasing ultra-processed foods. We felt that would have too much of a negative impact on food affordability for people using SNAP, so we did not recommend that.
What comes next for this research?
JK: Our next step is to share this definition with as many policymakers as we can, and then offer them technical support if they want to figure out how to use this in legislation or regulation. The second thing is if any legislators, policymakers or advocates want to pursue policies, we’re available to provide technical support and assistance.
There’s also a bunch of additional research that would be useful. We have some of those recommendations at the end of the report, but as an example, there’s controversy right now over different subgroups of UPFs and whether some are more harmful than others. The research that’s been done so far has been somewhat confusing and flawed. There’s also research on how, exactly, ultra-processed foods cause all these problems. There are a lot of great, interesting hypotheses, but I wouldn’t say any of them are definitive.
As an expert in this field, how do you approach ultra-processed foods in your own life, and how would you recommend people think about reducing their own consumption?
JK: Right now, about 60% of the calories that Americans consume are ultra-processed foods. Starting there, small and incremental steps are great. You can’t totally change your diet overnight, so the bottom-line message is to think about small things you can do.
The first challenge is identifying UPFs, which is where we started this conversation. If there are ingredients in food that you don’t have in your kitchen, it’s likely going to be a UPF, and if it’s a long ingredient list that looks like a chemistry lab, it’s probably a UPF. Then you can consider what the food looks like. If it’s super bright, like Froot Loops or Doritos, that probably means it’s a UPF.
But then once you’ve identified ultra-processed foods, what do you do? Let’s think about one thing you want to do. Say you drink a lot of sweetened beverages. You can think of what you can swap in that works for you, like sparkling water that doesn’t have a lot of additives, or coffee or tea.
As for me, I don’t eat many ultra-processed foods. When I started doing this work, when my kids were younger, I fed them all sorts of UPFs. I certainly wouldn’t do that now and wish I had known better. But if I want to have something that’s ultra-processed, that’s fine, it’s not going to kill you to have just a little bit. As long as your overall dietary pattern is healthy, then that’s great.
The panel was co-chaired by Krieger and Lindsey Smith Taillie of the University of North Carolina at Chapel Hill and convened by Mary Story and Megan Elsener Lott of Duke University. A full list of panel members is included in the panel’s technical report. This work was funded by Healthy Eating Research and the Robert Wood Johnson Foundation.
For more information or to contact Krieger, email Alden Woods at acwoods@uw.edu.
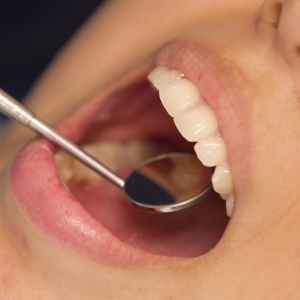
To rebalance the oral microbiome and cure chronic halitosis, researchers at the University of Washington are embarking on a first-of-its-kind experiment. These clinical trials transplant bacteria and other minuscule critters from healthy donors into patients with halitosis. If successful, the healthy microbiota will crowd out the bad and patients’ bad breath will improve.
To rebalance the oral microbiome and cure chronic bad breath, researchers at the University of Washington are embarking on a first-of-its-kind experiment. Credit: iStock
The human mouth is full of wonders. It’s home to hundreds of species of bacteria, fungi, viruses and protozoa, which work in delicate harmony to maintain our oral health. Sometimes, though, this complex system — known as the oral microbiome — can fall out of balance. Anaerobic bacteria build up on the tongue and in the little pockets between our teeth and gums. There, they break down organic matter and spew out a foul odor. This, the current theory goes, is what causes many chronic cases of bad breath, or halitosis.
To rebalance the oral microbiome and cure chronic halitosis, researchers at the University of Washington are embarking on a first-of-its-kind experiment. These clinical trials transplant bacteria and other minuscule critters from healthy donors into patients with halitosis. If successful, the healthy microbiota will crowd out the bad and patients’ bad breath will improve.
Researchers believe an imbalance in the oral microbiome may be a cause of bad breath. Here, a person blows into a halimeter, which measures the presence of foul-smelling compounds in a person’s breath. Credit: Jordon McAdams, University of Washington
“We know the oral microbiome can get out of whack. The question is, can you rebalance it? That is the hypothesis we’re proposing,” said Alvin Wee, a UW professor of restorative dentistry and co-lead of the project.
The experimental procedures build off recent breakthroughs in fecal microbiota transplants, commonly known as stool transplants, which have become a go-to treatment for gastrointestinal infections and bacterial imbalances.
The research team has so far completed four transplants, with preliminary evaluations underway. They’re seeking pairs of participants — a patient with chronic halitosis and a donor, ideally an intimate partner, family member or trusted friend — to undergo these relatively simple procedures.
To start, researchers complete a full periodontal exam of the donor to ensure their microbiome is healthy. Then they collect bacteria from the donor and suspend it in a small volume of saline. At the same time, recipients undergo a deep cleaning to remove the harmful bacteria and disrupt the biofilm — the thin, sticky layer of microorganisms that lines surfaces in the mouth. Recipients rinse with the donor solution, and researchers inject a concentrated version into the gumline. Ninety days after the transplant, participants self-report whether their breath has improved.
“What we’re trying to do is severely disrupt the original bacteria, and then we bring in the new guys to take hold and establish a new biofilm,” said co-lead Alex Pozhitkov, a research scientist and affiliate faculty member in the UW School of Dentistry. “If we bring enough of the new bacteria and they outcompete the ones that we disrupted, the healthy ones will take over. It’s a numbers game.”
This research was funded by the Dean and Margaret Spencer Clinical Research Fund. Co-investigators include professor of clinical practice Diane Daubert and professor Daniel Chan, both of the UW School of Dentistry. For more information, to reach the researchers or to inquire about participating, contact Pozhitkov at pozhit@uw.edu or Wee at awe@uw.edu.
University of Washington researchers launched a pilot app that maps ‘little free pantries’ throughout the Seattle area and gives pantry users and donors new tools to communicate with and help one another.
A micropantry in Seattle’s Beacon Hill neighborhood is stocked with nonperishable food for neighbors in need. In a new study, UW researchers launched an experimental mapping app designed to help users find nearby pantries and communicate with one another about sharing food. The team also outfitted several pantries with sensors that anonymously track usage and stock levels. Photo: Giacomo Dalla Chiara
Micropantries — commonly called “little free pantries” — and community fridges are a frequent sight throughout Seattle and the greater Puget Sound region. One estimate suggests that they supply around 4 million pounds of food per year to neighbors in need in the Seattle area, more than the state’s largest food bank. The curbside cupboards are a decentralized, community-driven effort to fight food insecurity and reduce food waste at the neighborhood level, but their ad hoc nature limits their dependability — users don’t know when food is available without repeatedly checking, and donors don’t know what foods are needed most.
Now, anyone who interacts with micropantries or community fridges in the Seattle area can try out an experimental app, made by University of Washington researchers, that brings a suite of new features to the micropantry network. The app, called PantryMap.org, maps many local pantries across the region. The app also gives each pantry an activity feed where users can share food they’ve donated, report on stock levels, add requests to a wish list, post photos and leave other notes. The research team also retrofitted some pantries with sensors that anonymously auto-report their usage and stock levels to the app in real time.
“This is an effort to document and quantify the phenomenon of micropantries,” said Giacomo Dalla Chiara, a senior research scientist at the UW Urban Freight Lab. “Lots of micropantries and community fridges popped up around the time of the COVID-19 pandemic, and I was curious about who uses them and how they are used.”
The team was cognizant of privacy concerns and designed the smart pantry tech accordingly.
“Putting cameras in the pantries could give us a lot of information about what specific foods are moving through the system, but that may also deter users who are concerned about privacy,” said Vicente Arroyos, a UW doctoral student in the Paul G. Allen School of Computer Science & Engineering who designed and built the sensor suite. “Instead, we settled on simpler sensors that measure weight and interactions like opening the door to measure stock levels while preserving everyone’s anonymity.”
The researchers hope that neighbors will find new ways to connect and help one another through these tools. A user might see that stock levels are low in a nearby pantry, for example, and decide to add some food. Another user might request certain foods to accommodate their dietary restrictions.
The sensor-equipped pantries are a small subset of the dozens of pantries throughout Seattle, but in addition to providing some neighborhoods with enhanced food tracking, they will generate aggregate data that will help Dalla Chiara’s team study donor and usage behavior. Dalla Chiara also plans to survey donors to learn more about what motivates people to provide food to pantries.
“We know that there is a lot of food insecurity in Seattle and in the United States in general,” Dalla Chiara said. “But we know that there is also a lot of food waste — lots of people have a surplus of food. And we want to see how grassroots efforts like micropantries can address both food insecurity and waste at the same time.”
Dalla Chiara and his team recently completed a refit on a cold, sleetingMarchday at a pantry owned by Saint Paul’s Episcopal Church near Seattle Center. The church keeps the pantry regularly stocked, and rector Stephen Crippen is curious about the data the new system will produce.
“It puts numbers on what we’re actually accomplishing,” Crippen said. “It helps us get in touch with what’s going on on this street.”
The research team is also working with local businesses and nonprofits to encourage and track food distribution throughout the pantry network. In April, Seattle-based recycling startup Ridwell ran a nonperishable food drive across Seattle and delivered 25,000 pounds of food to the University District Food Bank; from there, volunteers from the Cascade Bicycle Club’s Pedaling Relief Project distributed the food to micropantries around the city by bike, giving the network an infusion of both food and usage data. The Washington State Department of Health and the nonprofit Sustainable Connections helped support the project’s community fridges effort.
Dalla Chiara recognizes that there are other grassroots micropantry mapping efforts online, and he doesn’t want his app to replace those services. Nor does he expect the smart pantry network to remain in service indefinitely — it costs about $150 to retrofit each pantry with sensors, and all that tech will be difficult to maintain after the study concludes in October of this year. At its core, the project is an effort to learn about micropantry usage and explore how technology might encourage sharing of resources and mutual aid systems.
“We’re trying to measure and quantify goodwill,” Dalla Chiara said. “Behind each little free pantry there is a whole system of behaviors — people trying to help one another. If we can understand that system better, we can support it better.”
Other UW collaborators include Anne Goodchild, professor of civil and environmental engineering and director of the Urban Freight Lab; Emily Hovis, assistant teaching professor of environmental and occupational health sciences; Marie Spiker, assistant professor of food systems, nutrition and health; and Vikram Iyer, assistant professor in the Allen School.
For more information, contact Dalla Chiara at giacomod@uw.edu.
Funding for drought relief actions and projects that mitigate drought impacts for designated federally recognized tribes within the Colorado River Basin. Geographic coverage: Specific federally recognized tribes in Arizona, California, Nevada, New Mexico, Utah, and Colorado -- Bureau of Reclamation, U.S. Department of the Interior
A leadership-based educational opportunity designed to support rural hospital officers who are navigating financial pressure, workforce shortages, operational complexity, and evolving healthcare regulations while providing essential healthcare to their communities. Geographic coverage: Texas -- Texas A&M University System, Texas State University System, Texas Tech University System, The University of Texas System, UTHealth Houston School of Public Health
Grants for qualified nonprofit organizations and tribal organizations to create a revolving loan fund to increase access to clean, reliable water and septic systems for households in eligible rural areas. Funding is designed to help individuals with low to moderate incomes finance certain costs of household water wells and individually owned decentralized wastewater systems that they own or will own. Geographic coverage: Nationwide -- U.S. Department of Agriculture, USDA Rural Utilities Service
Grants to support socioeconomic and cultural success for Native communities through business creation in regenerative agriculture, artificial intelligence, tribal energy sovereignty, and human capital development. Geographic coverage: Nationwide -- Administration for Children and Families, U.S. Department of Health and Human Services
Loan repayment assistance for new dentists in South Dakota who agree to serve a selected percentage of Medicaid-insured patients in their practice. Geographic coverage: South Dakota -- Delta Dental of South Dakota
If people with high blood pressure who are currently untreated added blood pressure medication to a high blood pressure treatment plan, thousands of deaths may be prevented over the next decade, according to an analysis in the Journal of the American Heart Association
Research Highlights:
A study evaluating the American Heart Association/American College of Cardiology 2025 guideline on high blood pressure found that among 81 million U.S. adults with high blood pressure and no cardiovascular disease, nearly 23 million (28%) may be newly eligible for blood pressure-lowering medication.
More than 9 million people who may need medical treatment to achieve optimal blood pressure may not currently be getting it.
Researchers found that people with high blood pressure and higher cardiovascular disease risk may need more than lifestyle changes to manage their blood pressure. Combining lifestyle changes along with taking blood pressure medication can be an effective strategy to lower blood pressure.
Embargoed until 4 a.m. CT/5 a.m. ET Wednesday, July 29, 2026
The 2025 American Heart Association/American College of Cardiology High Blood Pressure guideline advises lifestyle changes — eating a healthy diet, managing weight, getting regular physical activity and reducing salt and alcohol — as a key part of treatment for high blood pressure, with medication prescribed if appropriate. The guideline also suggests healthcare professionals use the American Heart Association’s PREVENTTM (Predicting Risk of cardiovascular disease EVENTs) risk equations to calculate 10-year cardiovascular disease risk among adults (ages 30-79 without known cardiovascular disease) with high blood pressure who do not have established cardiovascular disease.
This study is one of the first detailed assessments of the 2025 guideline on high blood pressure and updated cardiovascular disease risk estimates using the PREVENT risk equations.
“Through this study, our goal was to understand how many people may qualify for treatment according to the updated recommendations in the guideline and estimate how many deaths from any cause and from cardiovascular disease may be prevented in the long term if the guideline recommendations were applied and untreated patients received care that included medication,” said study lead author Mustafa Al-Jarshawi, M.B.Ch.B., M.Sc., MRCPUK, PgCert, an academic clinical fellow in cardiology, member of the Cardiovascular Research Group at the Centre for Prognosis Research at Keele University in the United Kingdom and honorary research fellow at the Centre for Health Informatics, University of Manchester.
Researchers examined links between blood pressure treatments and rates of deaths from all causes and from cardiovascular conditions. Their analysis predicted how many lives may be saved if treatment plans outlined in the 2025 guideline were prescribed.
The data analysis found:
81 million U.S. adults had a diagnosis of high blood pressure. Of these, 22.8 million (28%) were guideline-eligible for therapy based on a blood pressure reading of 130/80 mm Hg or higher. 13.1 million (57%) adults were already receiving treatment for high blood pressure, while 9.7 million (43%) remained untreated. Please note: The blood pressure readings were measured during one office visit for the National Health and Nutrition Examination Survey (NHANES) collected between 2009 and 2018. The current guideline advises taking multiple readings during multiple office visits. This is an important study limitation.
The analysis estimates that, among eligible adults, receiving blood pressure-lowering medications was associated with a 23% lower risk of dying from any cause and a 50% lower risk of dying from heart-related issues. This was compared to eligible adults who do not receive treatment.
If treatment with medications was extended to all untreated but eligible adults, the analysis estimates approximately 200,000 all-cause deaths and 162,000 cardiovascular deaths may be prevented during the next decade.
People eligible for high blood pressure treatment with medication who would benefit most were older, with an average age of 66, and had more health conditions, including diabetes, chronic kidney disease and other cardiovascular disease risk factors.
“What stood out most was the size of the treatment gap — more than 40% of people who were clearly eligible under the new guideline were not receiving treatment, as well as the scale of the potential benefit,” Al-Jarshawi said.
“Lifestyle modification remains the foundation of high blood pressure management. Maintaining a healthy weight, consuming a heart-healthy diet, reducing sodium intake, increasing physical activity, getting enough sleep, managing stress and limiting alcohol can meaningfully lower blood pressure and overall cardiovascular risk,” said study senior author Mamas A. Mamas, M.D, DPhil., Professor of Cardiology at Keele University and Honorary Professor of Population Health at the University of Manchester. “For many people, especially those with blood pressure under 140/90 mm Hg and no history of heart disease, stroke, chronic kidney disease or diabetes, lifestyle changes can be enough at first. If your 10-year risk of heart disease is low, with a PREVENT score under 7.5%, maintaining a healthy lifestyle can help you delay or avoid needing medication. Even if you do need medication to lower blood pressure, making lifestyle changes is important for effective treatment and overall health.”
“The 2025 guideline emphasizes a personalized approach to managing high blood pressure by considering blood pressure levels plus 10-year and 30-year overall cardiovascular disease risk. The American Heart Association’s PREVENT risk equations help to identify individuals who could benefit from treatment before a major cardiac event,” said Chair of the American Heart Association’s 2025 guideline writing committee Daniel W. Jones, M.D., FAHA.
“Controlling blood pressure is crucial for long-term health. While lifestyle changes are the foundation for better overall health, people with high blood pressure and higher risk for cardiovascular disease may also need medication to reduce the risk of serious complications from untreated high blood pressure. Healthcare professionals should assess overall cardiovascular risk and work together with their patients to combine lifestyle strategies and medication for optimal blood pressure control.” Jones, who was not involved in this study, is a past volunteer president of the American Heart Association (2007-2008) and is dean and professor emeritus of the University of Mississippi School of Medicine in Jackson, Mississippi.
Study details, background, design and limitations:
The study had 53% male and 47% female participants, 9.4% had chronic kidney disease, 17 % had diabetes, 47% had dyslipidemia and 15% were current smokers.
The participants self-identified as 70% white adults, 12% Black adults, 7.2% Mexican American adults, 5.8% multiracial adults and 4.2% other Hispanic adults.
Study limitations include that researchers did not randomly assign the treatment, which means other unmeasured factors may have influenced treatment and the results. Since blood pressure was measured during a single NHANES visit and researchers examined treatment at only one point in time, the study could not capture how patients’ medication use or treatment routines may have changed over time as they worked with their healthcare teams.
Co-authors, disclosures and funding sources are listed in the manuscript.
Studies published in the American Heart Association’s scientific journals are peer-reviewed. The statements and conclusions in each manuscript are solely those of the study authors and do not necessarily reflect the Association’s policy or position. The Association makes no representation or guarantee as to their accuracy or reliability. The Association receives more than 85% of its revenue from sources other than corporations. These sources include contributions from individuals, foundations and estates, as well as investment earnings and revenue from the sale of our educational materials. Corporations (including pharmaceutical, device manufacturers and other companies) also make donations to the Association. The Association has strict policies to prevent any donations from influencing its science content and policy positions. Overall financial information is available here.
Additional Resources:
Multimedia is available on the right column of release link.
Follow American Heart Association/American Stroke Association news on X @HeartNews
Follow news from the Journal of the American Heart Association on X @JAHA_AHA
###
About the American Heart Association
The American Heart Association is a relentless force for a world of longer, healthier lives. Dedicated to ensuring equitable health in all communities, the organization has been a leading source of health information for more than one hundred years. Supported by more than 35 million volunteers globally, we fund groundbreaking research, advocate for the public’s health, and provide critical resources to save and improve lives affected by cardiovascular disease and stroke. By driving breakthroughs and implementing proven solutions in science, policy, and care, we work tirelessly to advance health and transform lives every day. Connect with us on heart.org, Facebook, X or by calling 1-800-AHA-USA1.
For Media Inquiries and AHA/ASA Expert Perspective: 214-706-1173
People with congenital heart disease living in states with lower average household incomes and higher percentages of uninsured residents had increased rates of death and disability, according to a new study in the Journal of the American Heart Association
Research Highlights:
In an analysis of the Global Burden of Disease Study compared with U.S. Census data from 1990-2021, researchers found that people with congenital heart disease living in states with lower average household incomes and fewer people with health insurance had higher rates of death and disability.
The research authors hypothesize that this difference may be due to easier access to specialized care and treatment from adult congenital heart disease cardiologists in communities with higher income levels and more residents with health insurance. Congenital heart disease requires lifelong, regular access to specialized cardiac care.
Expanding access to expert care, particularly in under-resourced regions of the U.S., could play a profound role in improving survival and quality of life for adult congenital heart disease patients.
Embargoed until 4 a.m. CT/5 a.m. ET Wed., July 15, 2026
DALLAS, July 15, 2026 — People with congenital heart disease living in states with low household incomes and limited access to health insurance and the specialized care they need may be more likely to become disabled or die from congenital heart disease, according to new, independent research published today in the Journal of the American Heart Association, an open-access, peer-reviewed journal of the American Heart Association.
Over the past 30 years, more children with congenital heart disease have survived into adulthood due to better surgical and catheter-based treatments, as well as improvements in medical care. As these children grow into adults, they continue to require specialized cardiac care, as recommended by evidence-based American Heart Association/American College of Cardiology guidelines, to maintain lifelong health and well-being.
This is one of the first studies to examine the connection between the health and survival of adults with congenital heart disease based on state-level data from the Global Burden of Disease Study along with income and insurance data from the U.S. Census, spanning from 1990 to 2021. Researchers examined the relationship among income levels, disability and death rates for nearly 300,000 adults with congenital heart disease aged 20 years and older.
“Understanding how social and economic factors can influence survival and outcomes is essential. Long-term outcomes and quality of life depend heavily on access to specialized, lifelong care for people with congenital heart disease,” said senior author Anitha John, M.D., Ph.D., medical director of the Washington Adult Congenital Heart Program at Children’s National in Washington, D.C. “Seeing how these factors affect patients long term allows us to better identify people at highest risk for complications. Then we can work toward improving access and reducing care gaps for people who have congenital heart disease.”
What are the key findings of the analysis?
As median household income increased in a state, the death rate for people with congenital heart disease decreased.
The relationship between death rate and individual income levels was stronger than the connection between death rates and the percentage of residents without insurance in each state. This suggests that simply having health insurance did not guarantee that people accessed the specialized care required for congenital heart disease. One reason for this might be differences in types of insurance coverage versus the overall presence of insurance.
Geography and access to resources (namely, specialized cardiac care) likely play a profound role in death and disability in adults with congenital heart disease in the U.S. More research is needed to understand these connections and their impact on the health, well-being and survival of people with congenital heart disease.
“While having health insurance does matter, it does not explain the differences we found in terms of how long people with congenital heart disease live,” John said. “This indicates that insurance alone doesn’t guarantee access to care. People may still face barriers if their insurance doesn’t cover specialized heart care or if out-of-pocket costs are too high. In many cases, specialized care may not be available in their area at all. We need to make sure everyone with congenital heart disease has the same access to specialty care throughout their lifetime, regardless of where they live.”
“We also need more trained specialists in adult congenital heart conditions. These medical experts should be more evenly distributed across the country, particularly where congenital heart disease patients live and work. Additionally, we need better systems to help patients get referred to the right care throughout their lives,” she said. “Expanding telehealth and improving insurance networks may also help to improve access.”
Michelle Gurvitz, M.D., an American Heart Association volunteer expert and chair of the writing committee for the 2025 ACC/AHA/HRS/ISACHD/SCAI joint Guideline for the Management of Adults With Congenital Heart Disease, said, “The 2025 guideline outlines when to seek expert assistance and how specialists can work together with other healthcare providers to enhance access to care. Many patients stop receiving specialized care when they transition from pediatric to adult care. Additionally, this study shows that some patients cannot see specialists because of issues such as insurance or their location.” Gurvitz, who was not involved in this study, is also a cardiologist at Boston Children’s Hospital and an associate professor of pediatrics at Harvard Medical School.
According to the American Heart Association’s 2026 Heart Disease and Stroke Statistics, congenital heart defects (heart or blood vessel issues that are present at birth) are one of the most common birth defects around the world. Congenital heart disease is the leading cause of death in the U.S. from a condition present since birth.
What are the study details, background, design and limitations?
Researchers reviewed data on death rates and ”disability-adjusted life years“ – the number of healthy life years lost due to a condition.
Income levels, including household income and insurance status (considered uninsured if they lacked coverage for a full year), detailed by state were secured from the U.S. Census Bureau data.
The findings show associations among the data points such as income, but cannot be interpreted as cause and effect. The associations found in the analysis may be influenced by factors like access to care, which the researchers could not directly measure.
Co-authors, disclosures and funding sources are listed in the manuscript.
Studies published in the American Heart Association’s scientific journals are peer-reviewed. The statements and conclusions in each manuscript are solely those of the study authors and do not necessarily reflect the Association’s policy or position. The Association makes no representation or guarantee as to their accuracy or reliability. The Association receives more than 85% of its revenue from sources other than corporations. These sources include contributions from individuals, foundations and estates, as well as investment earnings and revenue from the sale of our educational materials. Corporations (including pharmaceutical, device manufacturers and other companies) also make donations to the Association. The Association has strict policies to prevent any donations from influencing its science content and policy positions. Overall financial information is available here.
Additional Resources:
Multimedia is available on the right column of the release link
Follow American Heart Association/American Stroke Association news on X @HeartNews
Follow news from the Journal of the American Heart Association on X @JAHA_AHA
###
About the American Heart Association
The American Heart Association is a relentless force for a world of longer, healthier lives. Dedicated to ensuring equitable health in all communities, the organization has been a leading source of health information for more than one hundred years. Supported by more than 35 million volunteers globally, we fund groundbreaking research, advocate for the public’s health, and provide critical resources to save and improve lives affected by cardiovascular disease and stroke. By driving breakthroughs and implementing proven solutions in science, policy, and care, we work tirelessly to advance health and transform lives every day. Connect with us on heart.org, Facebook, X or by calling 1-800-AHA-USA1.
For Media Inquiries and AHA Expert Perspective: 214-706-1173
American Heart Association Basic Cardiovascular Sciences Meeting Report – Poster Presentation WED002
Research Highlights:
A lab study investigating mouse and human cardiac tissue found a potential link between gum disease (periodontitis) and a narrowing of the aortic valves (aortic valve stenosis).
Currently, there is no medication or treatment available that can prevent or slow the progression of aortic valve stenosis.
However, these findings suggest that treating gum disease and associated inflammation of the gums might help prevent the most common form of heart valve disease.
Note: The study featured in this news release is a research abstract. Abstracts presented at the American Heart Association’s scientific meetings are not peer-reviewed, and the findings are considered preliminary until published as full manuscripts in a peer-reviewed scientific journal.
Embargoed until 8 a.m. CT/9 a.m. ET, Sunday, July 12, 2026
BOSTON, July 12, 2026 — Gum disease bacteria may spur calcium buildup in the heart’s aortic valve, leading to a common and serious heart valve disease, according to preliminary, independent research presented at the American Heart Association’s Basic Cardiovascular Sciences Scientific Sessions 2026. The meeting, in Boston, July 13-16, 2026, is one of the largest meetings globally dedicated to fundamental and translational research in cardiovascular science.
According to the American Heart Association, calcific aortic valve stenosis (CAVS) occurs when the aortic valve thickens and calcifies, restricting blood flow from the heart to the rest of the body. In early stages, there may be no symptoms; however, as the condition progresses, it can cause fatigue, chest pain, shortness of breath, fainting, heart failure and sometimes premature death. Standard treatment for severe CAVS is valve replacement surgery.
This study identifies a potential biological pathway linking chronic oral gum disease and infection to calcific aortic valve stenosis.
“There are currently no medications proven to prevent or slow the progression of CAVS. We hope our findings demonstrating the link between periodontal disease and CAVS will stimulate further research into new preventive and therapeutic approaches for this condition,” said co-lead author of the study, Chenyang Li, M.D., a Ph.D. candidate in the department of cardiology at the State Key Laboratory of Cardiovascular Disease of Fuwai Hospital’s National Center for Cardiovascular Diseases, the Chinese Academy of Medical Sciences and Peking Union Medical College all in Beijing.
The researchers focused on the bacteria called Porphyromonas gingivalis (P. gingivalis), which plays a disproportionately large role in causing gum inflammation and the destruction of gum tissue. P. gingivalis has also previously been associated with systemic inflammation and the risk of cardiovascular disease, including plaque buildup in the arteries and coronary artery disease.
The researchers measured different bacterial levels in human cardiac valve tissue removed during valve replacement surgery. They studied samples from people with CAVS and from those with other valve diseases.
“We were surprised by how much P. gingivalis was present in the calcified aortic valves,” Li said. “Although it was not one of the most abundant bacteria overall, it showed one of the largest differences between valves with CAVS and valves without CAVS. This unexpected finding led us to investigate its potential role in the development of CAVS.”
Using mice, researchers also explored how P. gingivalis might be linked to the development of CAVS. Researchers gave mice live and heat-inactivated P. gingivalis to see if the bacteria built up in the aortic valve, caused more calcification and led to symptoms of aortic stenosis. Some mice received antibiotics, while in others the IL-1β inflammatory pathway was genetically disabled or removed.
Researchers found that repeated exposure of mice to live P. gingivalis led to the accumulation of bacteria in aortic valves, increased valve calcification and symptoms of aortic stenosis, while preventive antibiotic treatment reduced these effects. In the mouse valve cells, P. gingivalis activated interleukin-1 beta (IL-1b), an inflammation-spurring protein made mainly by the body's immune cells.
In further testing, when researchers genetically deleted IL-1b in the mice, calcification and valve symptoms were significantly reduced even in the presence of P. gingivalis.
“The key message is simple: take good care of your oral health,” Li said. ”Good oral hygiene and treatment of periodontal disease are important for overall health and may also have benefits for cardiovascular health. While it is still too early to recommend specific treatments for preventing CAVS, our findings suggest that periodontal health could be an important piece of the puzzle.”
“This study adds to the growing evidence that oral health and heart health are closely connected,” said Eduardo Sanchez, M.D., M.P.H., FAHA, chief medical officer for prevention for the American Heart Association. “For many people, regular visits to the dentist are their only connection to the healthcare system. That makes dental professionals important partners in spotting health conditions, including periodontal disease early — which can lead to quicker healthcare referrals and results, better health and lives saved.”
The American Heart Association’s Healthy Smiles, Healthy Hearts™ initiative provides dental care teams with professional education highlighting the connection between oral health and heart health, a standard blood pressure screening and referral guide for patients in dental settings, and educational materials for patients to help improve both their oral and heart health.
The study has limitations because its findings have not been confirmed in people. The researchers have started a clinical study to further evaluate the link between gum disease and CAVS.
Co-authors, their disclosures and funding sources are listed in the abstract.
Statements and conclusions of studies that are presented at the American Heart Association’s scientific meetings are solely those of the study authors and do not necessarily reflect the Association’s policy or position. The Association makes no representation or guarantee as to their accuracy or reliability. Abstracts presented at the Association’s scientific meetings are not peer-reviewed, rather, they are curated by independent review panels and are considered based on the potential to add to the diversity of scientific issues and views discussed at the meeting. The findings are considered preliminary independent research until published as a full manuscript in a peer-reviewed scientific journal.
The Association receives more than 85% of its revenue from sources other than corporations. These sources include contributions from individuals, foundations and estates, as well as investment earnings and revenue from the sale of our educational materials. Corporations (including pharmaceutical, device manufacturers and other companies) also make donations to the Association. The Association has strict policies to prevent any donations from influencing its science content and policy positions. Overall financial information is available here.
Additional Resources:
Multimedia is available on the right column of the news release link.
American Heart Association health information: Oral Health
Follow AHA/ASA news from the meeting on Twitter @HeartNews, #BCVS26
###
BCVS is one of the largest meetings in the world dedicated to fundamental and translational research to improve heart health, a goal that the pandemic has only made more critical. Presented by the American Heart Association’s Basic Cardiovascular Sciences Council, the 2026, in-person conference attracts leading researchers in fields such as microRNAs, cardiac gene and cell therapy, cardiac development and also includes tissue engineering and iPS cells. Follow the conference on X at #BCVS26.
About the American Heart Association
The American Heart Association is a relentless force for a world of longer, healthier lives. Dedicated to ensuring equitable health in all communities, the organization has been a leading source of health information for more than one hundred years. Supported by more than 35 million volunteers globally, we fund groundbreaking research, advocate for the public’s health, and provide critical resources to save and improve lives affected by cardiovascular disease and stroke. By driving breakthroughs and implementing proven solutions in science, policy, and care, we work tirelessly to advance health and transform lives every day. Connect with us on heart.org, Facebook, X or by calling 1-800-AHA-USA1.
Alcohol and smoking were linked to both breast cancer and atrial fibrillation/flutter, according to a global analysis published in the Journal of the American Heart Association
Research Highlights:
A new, global analysis finds atrial fibrillation/flutter and breast cancer rates may follow similar risk factors and patterns across regions, particularly among women ages 55 and older.
In about 40% of the 204 countries and regions evaluated, the rates of both breast cancer and atrial fibrillation/flutter were similar in older women, with the highest-risk zones in Western nations.
Researchers identified modifiable risk factors, particularly alcohol use and smoking, which could substantially reduce the impact of both conditions.
Embargoed until 4 a.m. CT/5 a.m. ET Wed., July 8, 2026
DALLAS, July 8, 2026 — Alcohol use and smoking were linked to breast cancer and atrial fibrillation/flutter in women ages 55 years and older in multiple regions of the world, according to new, independent research published today in the Journal of the American Heart Association, an open access, peer-reviewed journal of the American Heart Association.
The number of breast cancer and atrial fibrillation, also called AFib or irregular heartbeat, cases represent a growing global health burden, according to study authors. Why these conditions have similar rates in specific parts of the world is not well understood.
“Identifying shared risk factors is important for developing interventions that support optimal health, such as smoking cessation and alcohol restriction, which could potentially reduce the global incidence of breast cancer and atrial fibrillation/flutter substantially,” said study co-author Shu Wang, M.D., Ph.D., director of the Breast Disease Center at Peking University People’s Hospital in Beijing.
In this analysis, researchers investigated the rates of breast cancer and atrial fibrillation/flutter in women ages 55 and older in 204 countries and regions worldwide. They evaluated women’s exposure to 58 shared and distinct health, behavioral and lifestyle risk factors, including smoking, alcohol use, body mass index and physical activity.
What are the results of the analysis?
Researchers noted 80 countries or territories of 202 (39%) had similar rates of both breast cancer and atrial fibrillation/flutter. About 65 countries (32%) were noted to be breast cancer-dominant, and 57 countries (28%) were atrial fibrillation/flutter-dominant.
After accounting for multiple variables, smoking and alcohol use were linked to higher rates of both breast cancer and atrial fibrillation/flutter.
An additional analysis found that reducing alcohol intake and smoking could potentially reduce the risk of breast cancer by about 15% and the risk of atrial fibrillation/flutter by about 12% worldwide.
Alcohol use was found to be a significant contributor to breast cancer (9.27% of cases) and atrial fibrillation/flutter (7.57% of cases).
High-income and developed nations, such as the U.S., Canada, Australia, New Zealand and much of Europe, exhibited elevated rates of both breast cancer and AFib, aligning with previous research linking Western diets and sedentary lifestyles to increased risks of cardiovascular and metabolic conditions and cancer.
“One of the most surprising aspects of our findings was how common both breast cancer and atrial fibrillation/flutter diagnoses were among women ages 55 and older in high-income regions, which highlights the influence of lifestyle,” Wang said. “This is the first study combining global data with machine learning to show the relationship between the conditions, their location across the world and the shared risk factors of these two conditions.”
The study results revealed high-risk zones were mostly in Western countries where there was greater exposure to smoking and alcohol use compared to Eastern regions, which can be attributed to differences in lifestyle, as well as social and community differences. Additionally, Western nations were more likely to have exposure to more types of risk factors, such as higher body mass index and more sedentary lifestyles, due to industrialization and transitions to more Western diets.
"Nowadays, more and more people are paying attention to the link between cancer and cardiovascular health," said study co-authors Zeye Liu, M.D., Ph.D., a surgeon in the department of cardiac surgery of Peking University People’s Hospital, and Yi Shi, M.D., Ph.D., the director of the department of cardiac surgery at Peking University People’s Hospital in Beijing. "Breast cancer and atrial fibrillation/flutter rise together across many regions of the world and share the same modifiable risk factors. From a cardiovascular perspective, this means that reducing smoking and alcohol use could help lower the risk of both conditions at the same time."
“Many of the same modifiable factors, including smoking, alcohol use, poor diet, physical inactivity and obesity, contribute to both breast cancer and cardiovascular disease including atrial fibrillation/flutter, as confirmed by this study’s findings,” said Laxmi Mehta, M.D., FAHA, chair of the American Heart Association’s Council on Clinical Cardiology. “This overlap underscores the importance of integrated lifestyle strategies to reduce risk of cardiovascular disease and cancer. The American Heart Association’s Life’s Essential 8 highlights key behaviors and health factors essential for prevention and reducing risk.” Mehta, who was not involved in the study, is also the director of preventative cardiology & women's cardiovascular health, the Sarah Ross Soter Endowed Chair in Women’s Cardiovascular Health Research and professor of internal medicine at The Ohio State University Wexner Medical Center in Columbus, Ohio.
The American Heart Association has previously identified that breast cancer and cardiovascular disease share some common risk factors that may be prevented through modifications like a healthy diet, physical activity, abstinence from tobacco and low alcohol intake, according to a 2018 Scientific Statement.
The newly developed spatial risk maps as part of this study can help guide region-specific prevention strategies and provide precise targets for future research. According to the researchers, the next step will be to incorporate long-term research, genetic and metabolic data into the analysis. Additionally, expanding the study to include socioeconomic factors will help develop individualized and region-specific prevention strategies.
What are the details, background, design and limitations of the study?
Researchers evaluated data from the Global Burden of Disease 2021 database to understand the incidence of breast cancer and atrial fibrillation/flutter, identifying the shared and distinct risk factors of both conditions.
The analysis focused on women 55 years of age and older in 204 countries and territories worldwide.
This is the first study to utilize machine learning to investigate the patterns across the globe, the relationship to breast cancer and atrial fibrillation/flutter co-occurring and the underlying region-specific risk drivers. Researchers created worldwide maps for healthcare professionals and policymakers to address prevention strategies customized to each region.
The analysis examined exposure to 58 risk factors that were both shared between conditions and distinct, that spanned environmental, lifestyle and metabolic factors, with 2 key risk factors primarily contributing to both conditions.
Study limitations include that it reviewed a large global database with broad healthcare information by country, which lacks data at the individual level, and the findings cannot prove any direct cause and effect. In addition, the country-level data may be limited based on the country’s resources to collect information, potential differences in screening and possibly inconsistent parameters for the conditions.
Co-authors, disclosures and funding sources are listed in the manuscript.
Studies published in the American Heart Association’s scientific journals are peer-reviewed. The statements and conclusions in each manuscript are solely those of the study authors and do not necessarily reflect the Association’s policy or position. The Association makes no representation or guarantee as to their accuracy or reliability. The Association receives more than 85% of its revenue from sources other than corporations. These sources include contributions from individuals, foundations and estates, as well as investment earnings and revenue from the sale of our educational materials. Corporations (including pharmaceutical, device manufacturers and other companies) also make donations to the Association. The Association has strict policies to prevent any donations from influencing its science content and policy positions. Overall financial information is available here.
Additional Resources:
Multimedia is available on the right column of release link.
Follow American Heart Association/American Stroke Association news on X @HeartNews
Follow news from the Journal of the American Heart Association on X @JAHA_AHA
###
About the American Heart Association
The American Heart Association is a relentless force for a world of longer, healthier lives. Dedicated to ensuring equitable health in all communities, the organization has been a leading source of health information for more than one hundred years. Supported by more than 35 million volunteers globally, we fund groundbreaking research, advocate for the public’s health, and provide critical resources to save and improve lives affected by cardiovascular disease and stroke. By driving breakthroughs and implementing proven solutions in science, policy, and care, we work tirelessly to advance health and transform lives every day. Connect with us on heart.org, Facebook, X or by calling 1-800-AHA-USA1.
For Media Inquiries and AHA/ASA Expert Perspective: 214-706-1173
More than 20 years of data show a 37% increase in obesity, 23% in abdominal obesity, and over two-fold increase in severe obesity among both adults and youth, according to authors of a new study published in the journal Circulation
Research Highlights:
Researchers analyzed U.S. health information from 1999 to 2023 and found that the prevalence of obesity increased from 30% to 41%, respectively.
Severe obesity among U.S. adults rose from 5% to 10%, and abdominal obesity (the accumulation of fatty tissue in the abdominal area) increased from 48% to 61%, respectively, during the 24-year study period.
Researchers recommended ongoing monitoring of body mass index (BMI) and waist circumference to help guide individual and population-wide prevention efforts targeting obesity as a major modifiable risk factor.
Embargoed until 4 a.m. CT/5 a.m. ET on Tuesday, July 7, 2026
DALLAS, July 7, 2026 — Obesity rates among U.S. adults and children rose sharply in recent years and by 2023, 40% of adults and 20% of youth met the criteria for obesity, according to new, independent research published today in the American Heart Association’s flagship journal Circulation.
“Obesity is a leading public health concern, linked to higher risks for cardiovascular disease and premature death,” said study author Anum Minhas, M.D., M.H.S., an assistant professor of medicine in cardiology at the Johns Hopkins School of Medicine in Baltimore. “Examining national trends in obesity can help determine which segments of the population may benefit the most from screening, how resources should be allocated for preventive efforts and the potential impact of implementing public health initiatives to reduce the burden of obesity.” Minhas said the research is believed to be the most contemporary evaluation of obesity trends among U.S. adults and youth.
In the study, researchers defined obesity as a body mass index (BMI) of 30 kg/m² or higher (except for Asian populations where distinct race-specific cutoffs were used). Obesity can increase the risks for health conditions, including Type 2 diabetes, high blood pressure, heart disease, stroke and chronic kidney disease. Severe obesity, which study researchers defined as a BMI greater than or equal to 40 kg/m², carries the highest risks for cardiovascular disease and death.
The first ever guideline from the American Heart Association on the Prevention, Detection, Evaluation and Management of Cardiovascular-Kidney-Metabolic disease, published in June 2026, states that obesity is the first stage of cardiovascular-kidney-metabolic syndrome. The guideline emphasizes obesity management in the form of diet and lifestyle modifications as essential for a longer, healthier life.
In this study, researchers examined how rates of various levels of obesity changed over more than 20 years, according to data from the National Health and Nutrition Examination Survey (NHANES). Rates and prevalence of obesity, severe obesity and abdominal obesity were analyzed, and potential trends by age, sex, race and ethnic groups were measured.
What are the key findings of the analysis?
Among the nearly 8,700 people in the U.S. surveyed between 1999 and 2023, including youth, defined as less than 20 years old, and adults, 20 years old and over.
Among adults, researchers found notable increases in the prevalence of obesity (30% to 41%, respectively), severe obesity (5% to 10%, respectively) and abdominal obesity (48% to 61%, respectively) in 1999 vs. 2023.
Among youth, researchers noted about a 30% increase for overall obesity, a 50% increase for severe obesity and a three-fold increase in abdominal obesity when comparing 1999 vs. 2023.
Disparities in obesity prevalence were also found in the analysis, with women being more likely to have severe obesity (13%) and abdominal obesity (70%) compared to men, who were less likely to have severe obesity (7%) and abdominal obesity (51%) as of the last time data was taken in 2023. The gap between women and men could be due to women having more hormonal differences and changes throughout their lives than men, researchers noted.
Throughout the period studied, non-Hispanic Black people consistently had the highest prevalence of all obesity compared to all other demographic groups.
These findings have major implications for cardiovascular disease and mortality, according to Minhas. “We must increase the availability and use of individual and population-level initiatives to target the rising epidemic of obesity and support people with obesity,” she said. “This includes pursuing a better understanding of which patients could benefit most from weight loss medications or other treatments. There are several effective weight loss therapies, including GLP-1 receptor agonist medications, bariatric surgery and other treatment options, confirmed in recent studies to have a positive impact on metabolic risk factors (blood sugar, blood pressure and cholesterol levels) and cardiovascular health, approved by the FDA and recommended in evidence-based treatment guidelines.”
What are the study’s details, background, design and limitations?
Between 1999 to 2023, a median of 8,687 individuals in the U.S. were surveyed through NHANES, including about 50% women. Approximately one-third of participants were youth younger than age 20 years, and two-thirds were adults ages 20 and older.
NHANES is conducted continuously at several sites across the U.S., and the researchers analyzed participants’ health information and survey responses between 1999 and 2023, including demographic, clinical and biomarker data.
Limitations of the analysis include that participants’ BMI measures were used to define obesity and classify different obesity levels. The study did not include body composition (fat mass versus lean mass) to classify participants’ obesity status or levels. In addition, NHANES response rates decreased over time, which increases the chance of nonresponse bias (those who didn’t respond may have had different outcomes or results from those who did continue to respond and participate in the survey, possibly skewing the results).
Co-authors, disclosures and funding sources are listed in the manuscript.
Studies published in the American Heart Association’s scientific journals are peer-reviewed. The statements and conclusions in each manuscript are solely those of the study authors and do not necessarily reflect the Association’s policy or position. The Association makes no representation or guarantee as to their accuracy or reliability. The Association receives more than 85% of its revenue from sources other than corporations. These sources include contributions from individuals, foundations and estates, as well as investment earnings and revenue from the sale of our educational materials. Corporations (including pharmaceutical, device manufacturers and other companies) also make donations to the Association. The Association has strict policies to prevent any donations from influencing its science content and policy positions. Overall financial information is available here.
Additional Resources:
Multimedia is available on the right column of release link.
Follow American Heart Association/American Stroke Association news on X @HeartNews
Follow news from the American Heart Association’s flagship journal Circulation on X @CircAHA
About the American Heart Association
The American Heart Association is a relentless force for a world of longer, healthier lives. Dedicated to ensuring equitable health in all communities, the organization has been a leading source of health information for more than one hundred years. Supported by more than 35 million volunteers globally, we fund groundbreaking research, advocate for the public’s health, and provide critical resources to save and improve lives affected by cardiovascular disease and stroke. By driving breakthroughs and implementing proven solutions in science, policy, and care, we work tirelessly to advance health and transform lives every day. Connect with us on heart.org, Facebook, X or by calling 1-800-AHA-USA1.
###
For Media Inquiries and AHA/ASA Expert Perspective: 214-706-1173